Deneb in Power BI
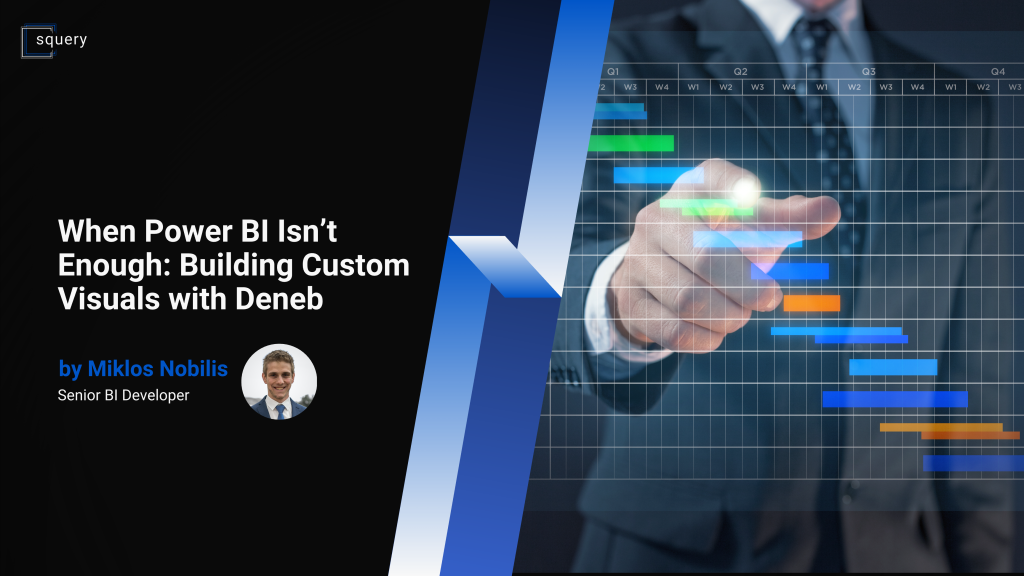
Unlock the full potential of your Power BI reports with Deneb! If you’ve ever struggled with the limitations of built-in charts, Deneb offers a game-changing solution. Imagine creating intricate Gantt charts that showcase project timelines, milestones, and comparisons between planned and actual efforts—all while maintaining interactivity. With the power of Vega and Vega-Lite, you can achieve unparalleled visual control and customization. Whether you’re a data analyst or a business intelligence professional, Deneb empowers you to craft stunning visuals that tell your data’s story. Dive in to discover how to elevate your Power BI experience!
Modern DevOps in Data Engineering with a Focus on Databricks
As organizations increasingly rely on data-driven decision-making, the expectations placed on analytics and engineering teams continue to grow. Delivering clean, reliable, and production-ready data workflows is no longer a luxury, but a requirement. This is where DataOps comes into play, as it brings DevOps thinking into the data world: reproducibility, automation, rapid iteration, quality assurance, […]
Mastering Power Query: Transform Your Data Like a Pro
Introduction In today’s data-driven world, efficiently managing and analyzing data is more crucial than ever. Enter Power Query is a powerful data connection technology that empowers users to discover, connect, combine, and refine data across various sources. Whether you’re an Excel enthusiast or a business intelligence professional, mastering Power Query can significantly enhance your data […]
Advanced Metrics in Sports Analytics: Going Beyond the Box Score

Advanced metrics like xG, PER, and EPA are redefining sports analytics, offering deeper insights into player performance and team strategies. Discover how these innovative stats are transforming the way we understand the game.
Optimizing Data Models in Power BI: Best Practices and Techniques
Learn how to create efficient data models in Power BI with our step-by-step guide. Discover best practices for performance, business alignment, simplicity, and maintainability.
A Beginner’s Guide to Machine Learning Algorithms in Data Science

Discover the essential machine learning algorithms in data science with this beginner’s guide. Learn about linear regression, decision trees, neural networks, and more.
Getting Started with Power Automate: Automate Your Business Processes

Discover how Microsoft Power Automate can streamline your business processes and improve productivity. Learn the basics and get started with automation today!
Advanced Transformations in Databricks: Spark SQL and Python
Databricks, leveraging Spark SQL’s Catalyst optimizer and PySpark’s flexibility, enables advanced data transformations for enterprise-grade analytics and AI solutions, enhancing data workflows and driving faster insights and better decision-making.
Unlocking Google Analytics 4 Insights with Squery’s Power BI Dashboard
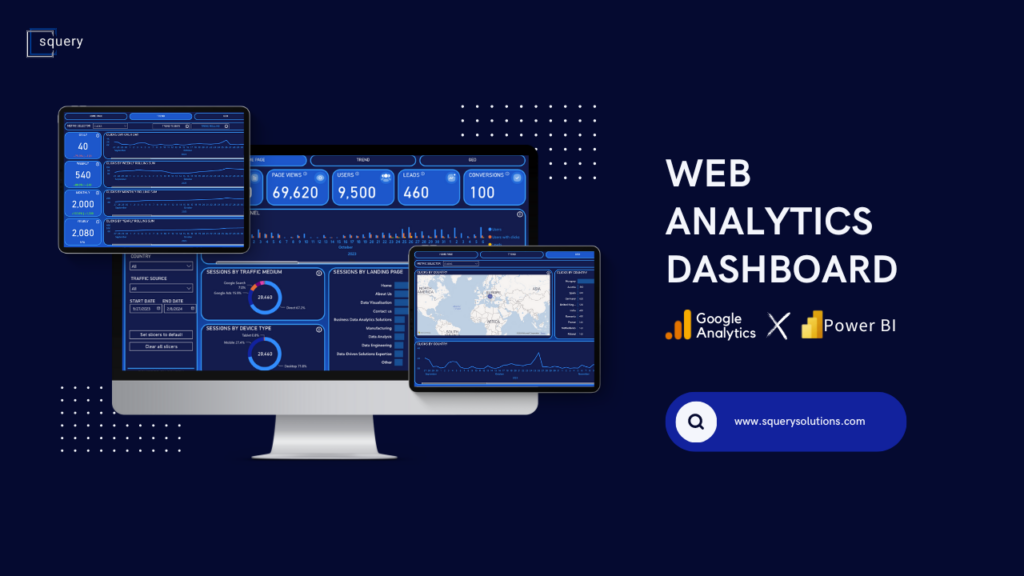
Get your Own Copy for FREE! Introduction to Squery’s Power BI Dashboard In the current digital era, grasping user behavior on websites is essential for businesses striving to succeed in the online space. With the evolution of Google Analytics to its latest version, GA4, the landscape of web analytics has shifted towards more insightful and […]
What are the benefits of switching to Microsoft Fabric?
Introduction Microsoft Fabric is a disruptive technology that will transform how businesses handle their data. Fabric is designed for simplicity which consolidates multiple sources of data into a single hub, reducing the time spent on data process understanding. Microsoft’s software strategy reduces the need for customers to navigate complex licensing processes, making it a seamless experience. But, […]